Top Modern GIS Skils for GIS Analysts in 2022
GIS Analysts serve the incredibly important purpose of providing detailed analysis and flexible results working with a wide range of data and tools. Not only do GIS Analysts work with many different stakeholder groups, but they also have to maintain a flexible workflow and use a wide range of data, delivering easy to use and understand results.
Modern GIS provides a unique set of tools that enables GIS Analysts and Specialists to work faster and deliver more insightful results. Below are some of the specific skill sets and tools that, in my opinion, help enable GIS Analysts.
Data Processing/ETL
? ? ? ? ⬜ ⬜ ⬜ ⬜ ⬜ ⬜ (4/10)
While GIS analysts will work with a wide range of datasets that are sourced from other sources like public data portals, most of this data should already be in a usable format like GeoJSON, Shapefile, or GeoTIFFs.
Of course, there is the occasional need for transforming an odd raster format or a random .tab file, but most of the heavy ETL work is performed by Geospatial Data Engineers. GIS Analysts can access those results through data lakes or other storage systems, or more commonly through a spatial SQL enabled database or data warehouse.
GDAL is the single fastest and most extensive tool for data transformation. It supports hundreds of different vector and raster data types and supports translating between file types and vectorizing/rasterizing data. QGIS has GDAL built into it as well if you prefer a desktop tool, but both work and GDAL at the command line level give you a bit more flexibility. GDAL is super fast as it is written in C++ and can speed up your data processing use cases.

Spatial SQL
⚙️ ⚙️ ⚙️ ⚙️ ⚙️ ⚙️ ⚙️ ⚙️ ⚪ ⚪ (8/10)
If you have read any of my other articles you will know that I am a major proponent of spatial SQL. I believe that it is one of the fundamental skills for modern GIS, and for GIS Analysts, the same applies. You can read more on why you should learn spatial SQL here and specifically how I define spatial SQL here, but the long story short is that you can:
- Speed up your analysis with spatial SQL and far faster queries
- Share consistent data across your organization
- Be more flexible in sharing code and analysis in your team and across others
GIS Analysts need a functional understanding of running different queries to produce analytical results. Some of the more technical aspects of spatial SQL (indexing, data ingest, INSERTs, triggers, user-defined functions, DBA processes, etc.) while good to know aren’t always necessary for the day-to-day work. The common SQL queries you will want to know are:
- SELECT
- WHERE
- AND, OR, NOT, IN
- LIMIT
- ORDER BY
- Handling NULL data
- SQL Functions
- AVG, MIN, MAX, COUNT, SUM
- GROUP BY
- LIKE and wildcards
- BETWEEN
- JOINs
- CREATE TABLE AS
- UPDATE and ALTER TABLE
- Subqueries and Common Table Expressions (CTEs)
- Window functions
And the spatial SQL specific areas to focus on are:
- Geometry formats (such as ST_AsGeoJSON)
- Geometry creation (such as ST_MakePoint or ST_GeomFromText)
- Geometry extraction (ST_X or ST_Y)
- Projections (ST_Transform)
- Measurements (ST_Distance)
- Geometry transformations (ST_Buffer or ST_Centroid)
- Aggregations (ST_Union)
- Relationships (ST_Intersects)
- Relationship transformations (ST_Intersection)
- Clusters (ST_DBScan)
Check out some resources for getting started for spatial SQL below:
Desktop Tools
?️ ?️ ?️ ?️ ?️ ?️ ?️ ?️ ?️ ?️ (10/10)
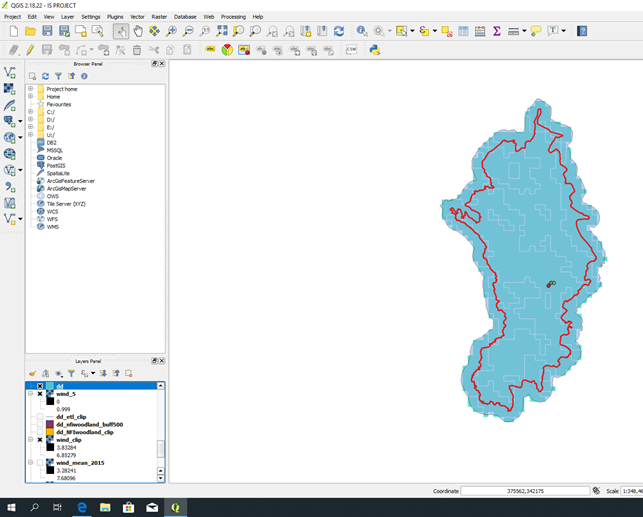
QGIS. Look no further! QGIS provides so much functionality for the classically trained GIS professional or someone who has only learned on open sources tools. It is a great way to test ideas or build complete professional projects.
QGIS has tons of built-in functionality and can be extended with a rich and growing network of plugins. It can solve just about any problem you might have and provide the right tools for the job. Plus, it is built using best-in-class open source tools integrated into it like GDAL and Leaflet.js and there is a large community of users that have tutorials and information to support you.
Here are some starter tutorials for QGIS:

you visualize, manage, edit, analyse data and compose printable maps.
Geospatial Python
? ? ? ? ? ? ⚪ ⚪ ⚪ ⚪ (6/10)
While geospatial Python is not a prerequisite for performing modern GIS analysis, it is a massively growing space and the flexibility it provides makes it a logical choice for GIS Analysts. You may not need to know all the details or write complex programs, but having the ability to create repeatable code to run common processes is a major tool in your toolkit.
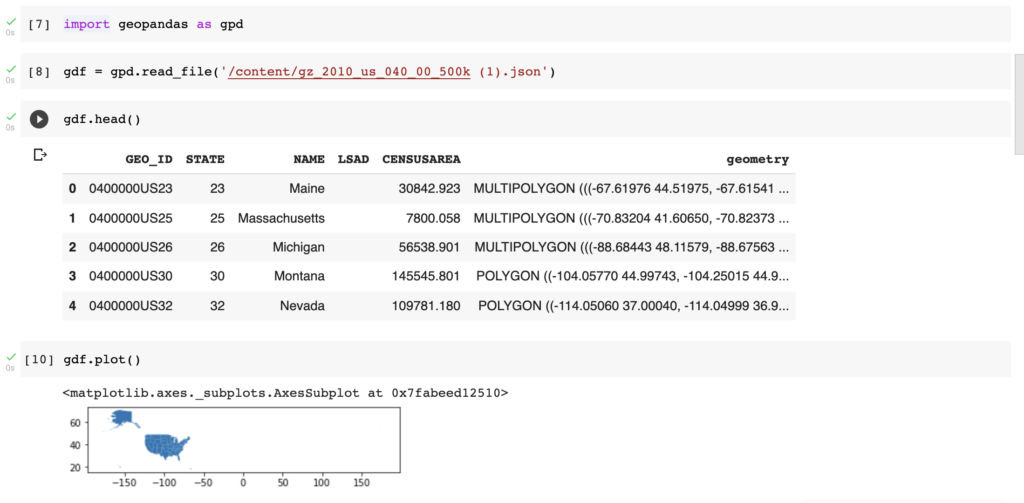
Geospatial Python provides so much flexibility and speed and the amazing number of libraries you can use to augment your analysis by reading different data sources or running different analyses is very important. For GIS Analysts, you need to have some basic understanding of Python and the ability to work with a few key libraries – namely Geopandas.
Geospatial Python is a big (really big) topic so check out this set of resources to get started and go deep with geospatial Python:
Spatial Data Science
? ? ? ⬜ ⬜ ⬜ ⬜ ⬜ ⬜ ⬜ ⬜ (3/10)
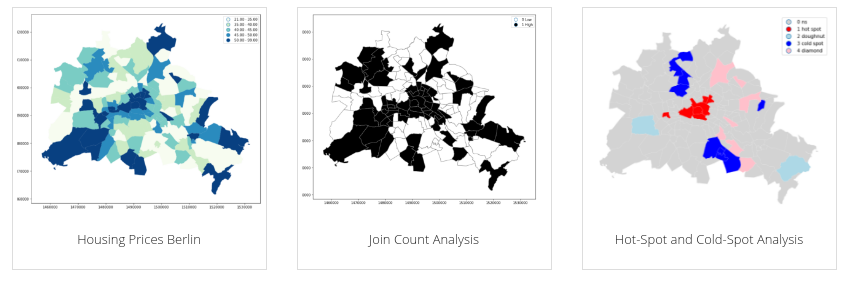
Spatial data science has been one of, if not the fastest, growing trends within the geospatial space. However, I feel that it is at the same time poorly defined. It can be anything from working with advanced statistics and models in some cases to working with Python in others. It is for that reason that it is important to understand what spatial data science is and what roles need to practice it.
For GIS Analysts, you don’t specifically need an in-depth knowledge of spatial data science, as in you don’t need to create or execute models from scratch, but a working knowledge of some of the tools available in packages like PySAL. The esda package is a good example of this because of its simplicity to execute and wide range of use cases it can be applied to, plus it is easily explainable to many audiences.
Having a deeper knowledge in the spatial data science space of course doesn’t hurt, but it is not a hard requirement for GIS Analysts.
Visualization
? ? ? ? ? ? ? ? ⚪ ⚪ (8/10)
Visualization, and visual communication, are critical skillsets for GIS Analysts. Being able to explain complex problems using the right color schemes, layers, visualization methods, quantification methods, breaks, and more can make or break your results and their readability by a wide range of audiences.
These techniques don’t only relate to the color schemes but also:
- How you display your data (polygon, centroid, clusters, 3D, proportional symbol)
- How many layers you choose to include
- Labeling
- Pop ups and click events
- Number of visualizations needed
- How engaging the visuals are
This is a very short list but there are so many more and a base background in cartographic design along with visual communication can help take your skills to the next level. Knowing your audience is another critical component. Knowing their familiarity of seeing and interacting with geospatial data, and how to visually present that information can also make or break how your audience understands your results.
Application Development
⚛️ ⚛️ ⚛️ ⚛️ ⬜ ⬜ ⬜ ⬜ ⬜ ⬜ (4/10)
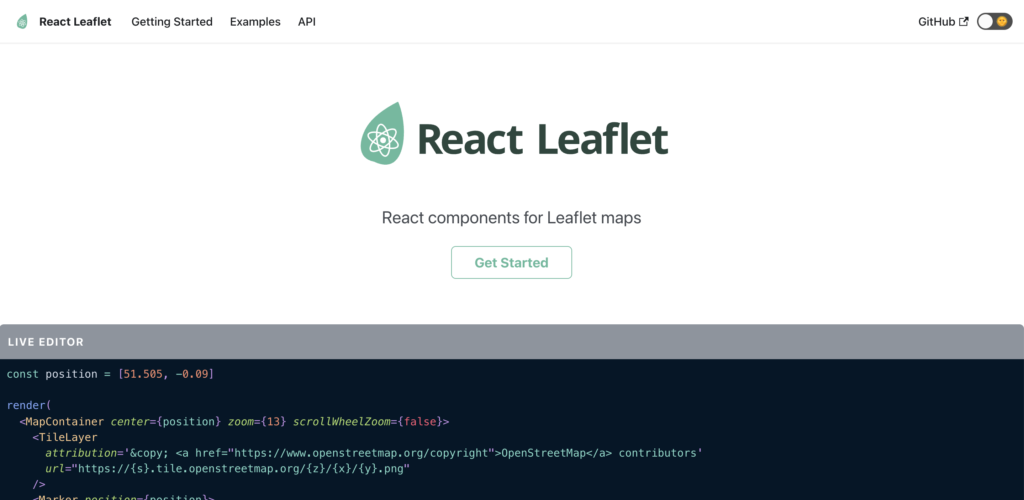
Geospatial application development can range from building a simple map output with Leaflet from QGIS all the way up to very complex full-stack applications. While the more complex work falls squarely in the court of Geospatial Developers, for GIS Analysts some frontend development skills will definitely elevate your work.
While you may not need to go too deep into this space, enough to be dangerous is sort of the name of the game. Having some basic HTML/CSS skills along with a working knowledge of Javascript will help you leverage libraries like Leaflet or DeckGL to build some simple applications or dashboards.
I would also recommend using other frameworks or development toolkits to help make your work faster and to build on top of the great work done by others. I am a major proponent of React, and using React with Material UI, along with other mapping libraries can help you use some great elements together. In fact, we used these core elements to build our CARTO for React library at CARTO.
Dashboards
? ? ? ? ? ? ? ⬜ ⬜ ⬜ (7/10)
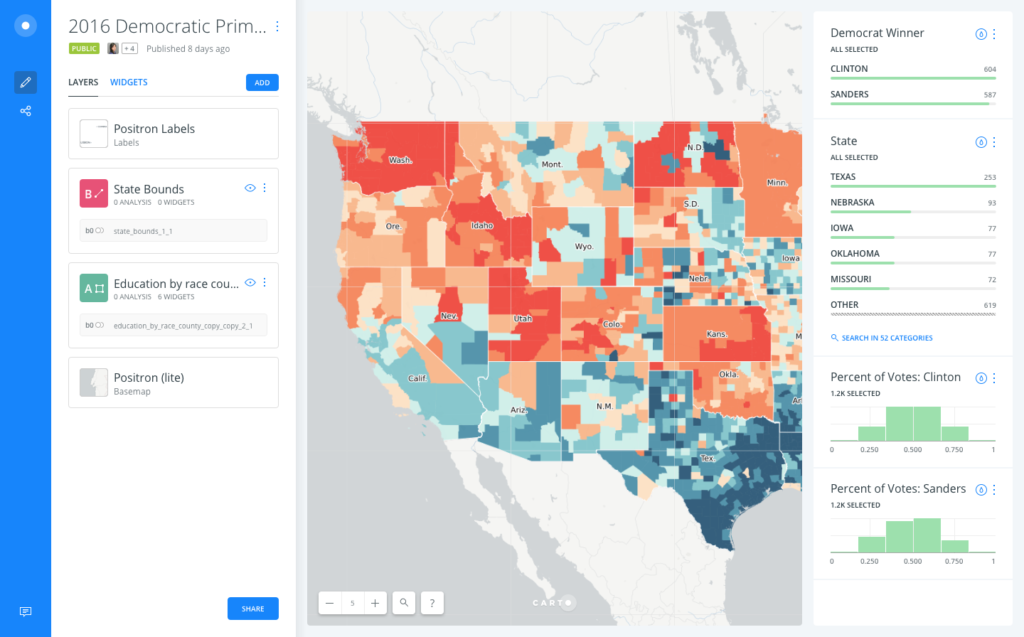
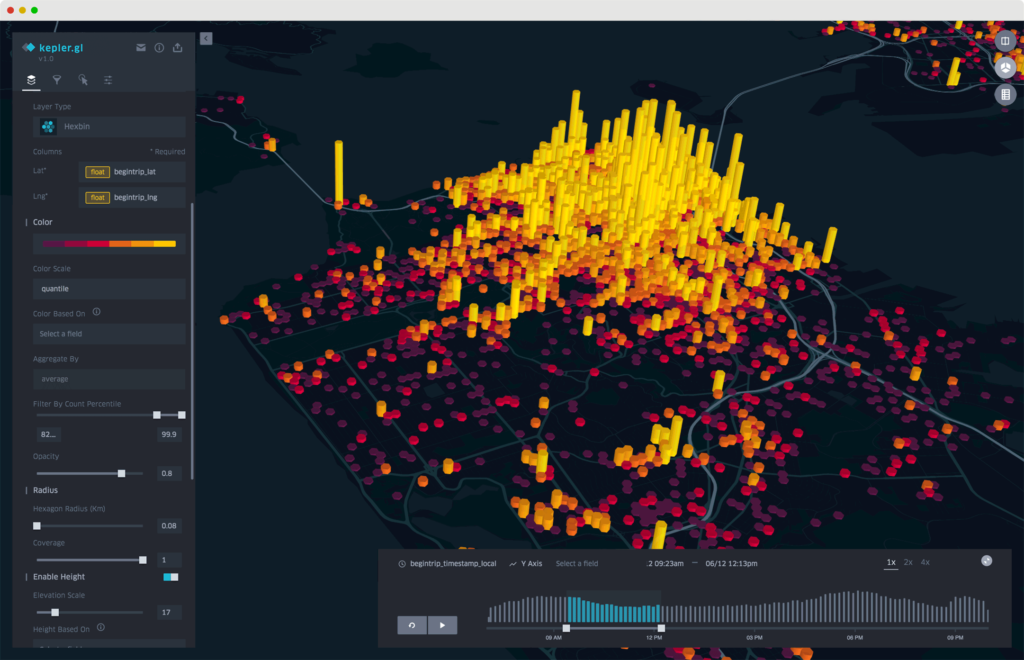
Dashboarding is a core component of work for GIS Analysts. There are many different tools you can use to accomplish this including non-geospatial tools like BI tools, but others like Kepler GL or CARTO allow for fast development and visualization of data along with simple filtering and widgets to interact with data.
The core elements to think about when developing a dashboard are:
- How to tell a concrete story through your dashboard
- What filters to include, and which ones work well together
- What data layers to include, and which ones to include by default
- What analysis you want to surface
- Creating multiple dashboards to tell a more logical story
Dashboards provide the ability to create analysis very quickly and surface you insights with speed, generally faster than building out a full application. These are great tools for GIS Analysts who generally focus on concrete questions that require a quick answer, and agility is a core skill for the GIS Analyst.
Communication Skills
?? ?? ?? ?? ?? ?? ?? ?? ⚪ ⚪ (8/10)
Of course, there are other skills outside the core technical toolkit for any modern GIS role. Having the ability to understand problems, translate them into relevant geospatial analysis, and then present results in a way that the audience can relate to and use is a critical skill for the GIS Analyst.
I think a core component of this boils down to understanding the desired outcome (or what someone wants to achieve) and the appropriate experience (how they want to interact with it). I have talked about this concept before but being able to focus on these two components is key for the GIS Analyst.
Some other key communication skills for the GIS Analyst include
- Understanding the audience and stakeholders you are working with and what they want to achieve with geospatial data
- Presentation skills and being able to distill complex geospatial analysis into simple concepts
- Present problems in an approachable format, often breaking them down into smaller pieces or stories
- Working with teams to discover the core root of a business problem and align geospatial data and analysis to help solve them
- Work to ensure stakeholders are able to use actionable steps from the information you provide, both now and in the future
GIS Analysts play a critical role in using modern GIS to solve problems with agility and accuracy, and these modern GIS skills can help bolster the ability you can help solve these complex problems.