
Geospatial can’t solve the current supply chain crunch – but it can help make it more resilient going forward
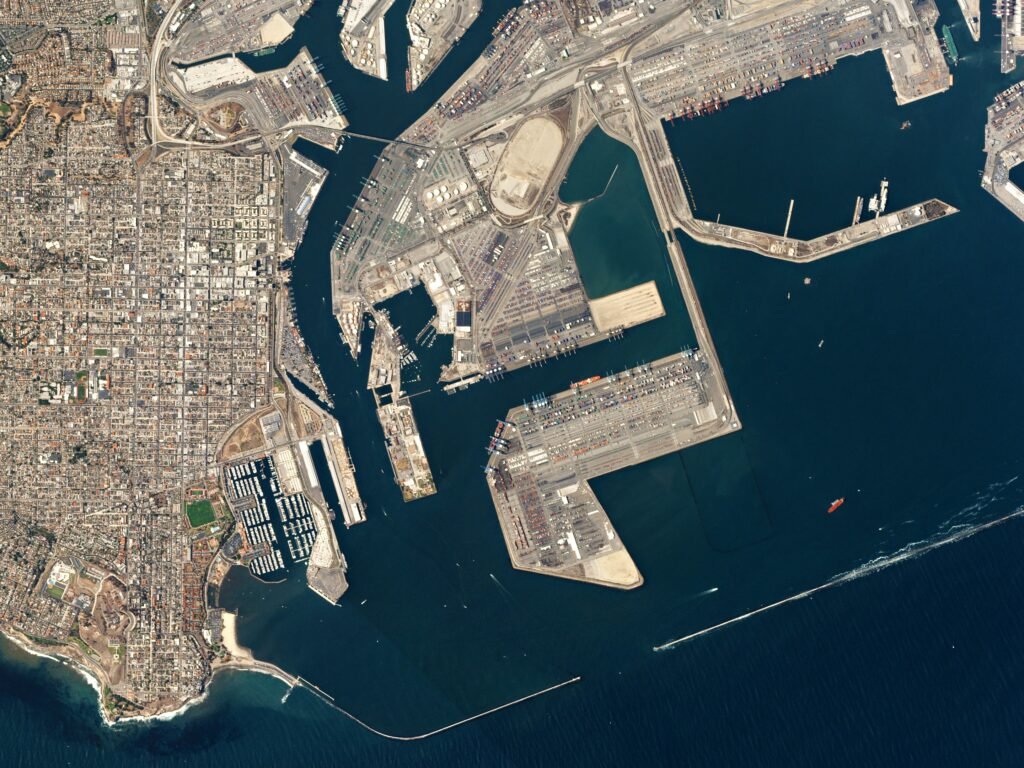
Around the world, the current supply chain disruptions and backlog are being felt by companies and consumers alike across a wide range of products and categories. This article from the Washington Post shows the view of the Port of Los Angeles and the developing backlog of ships from satellite imagery.
As a result, people working in GIS or geospatial have been asked in recent days if this could have been prevented, or at least lessened in severity, by using geospatial data and analysis.
While supply chains are geospatial at their core (directed networks with locations around the globe with a variety of transportation constraints), they are influenced by many other outside factors.
In this case, geospatial can’t solve the current supply chain crunch, but it may be able to help see them in the future.
I do believe that there are some ways we can use geospatial to see the current state of the crisis, but many of the applications of geospatial should be focused on preventing future issues. Here’s why.
What is driving the current crisis and why can’t geospatial help?
This article from the Los Angeles Times does a great job laying out the core issues with the current crisis:
- Factories and logistics companies activities being shut down due to COVID-19
- An increase in demand from consumers following the COVID-19 recession, specifically in online orders
- Increase in labor, transportation, and logistics costs
- Capacity constraints for warehouses, distribution centers, shipping, ports, and manufacturing
- Border restrictions make it harder to transport goods intentionally
Two things immediately stand out to me in that list: these causes are all high-level trends taking place around the country and world and that there aren’t great sources of geospatial data to analyze these phenomena. Using the same order as above, we can try and identify data and the scale of data we could use to find interesting insights:
- Some factories closed before others, but this is basically tied to the country level shutdowns during the COVID pandemic and nothing more granular
- We could see increases in brick and mortar retail demand using retail insights data and consumer segments more likely to order online, but real online shopping data is not something that is highly available and during the pandemic, this was a fairly cross-cutting trend
- Once again, a macro change taking place over a long period of time, and data likely exists and very high granularity like countries or states/provinces
- Border measures are something that can be mapped and analyzed, but generally, these insights may help with truck routes, but it wouldn’t alleviate the massive backlog of ships trying to dock
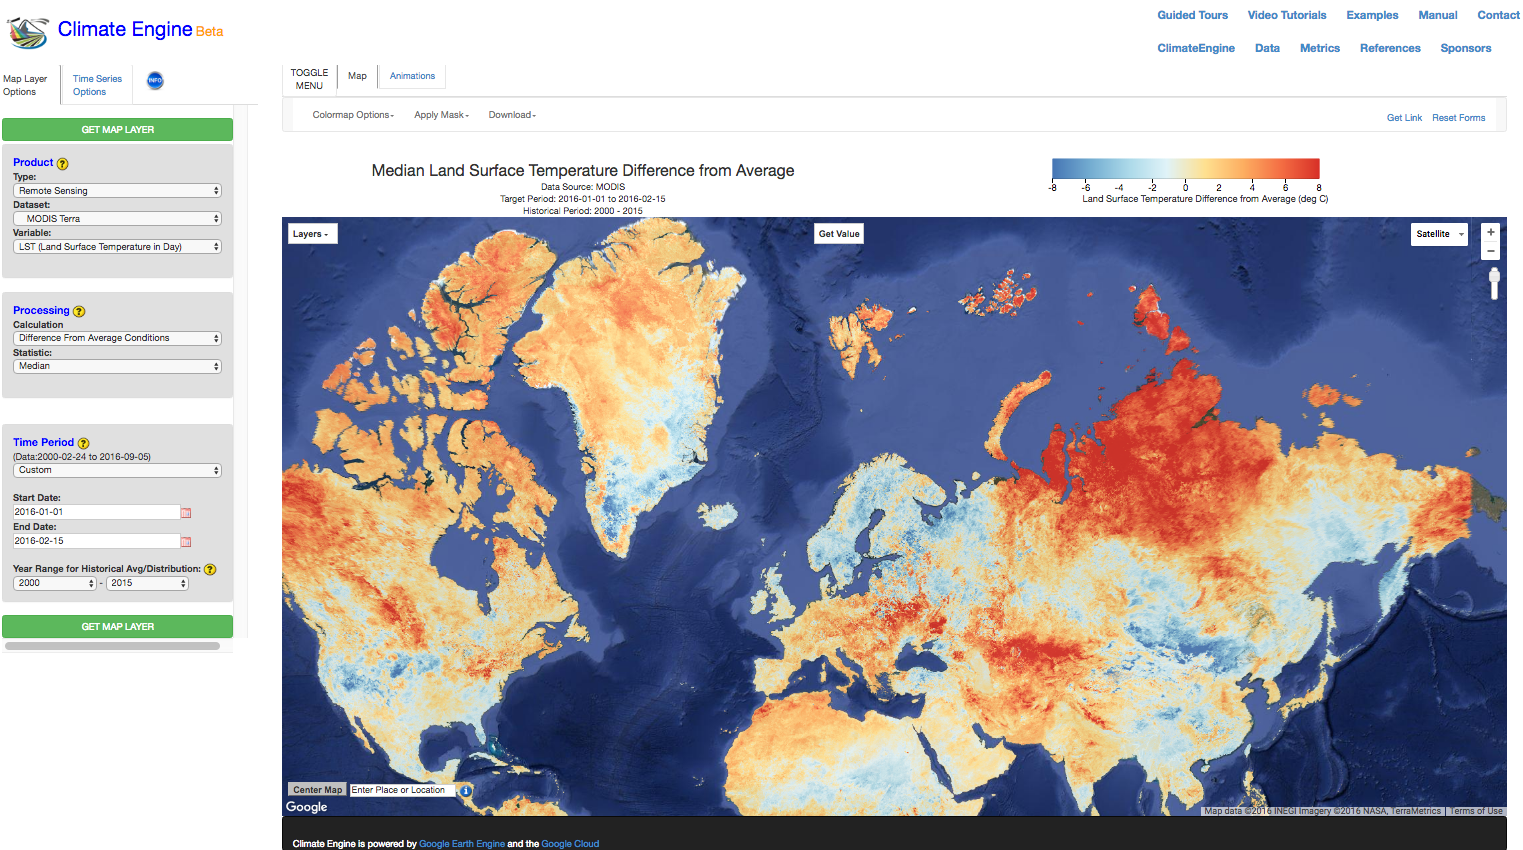
That being said, geospatial can help to visualize and understand the current clogs in the system such as ports, roads, border crossings, and airports. This data could come from remote sensing sources such as the dashboards produced by BLANK, or from other sources such as flight data (such as that provided by FlightRadar24) and shipping locations and data.
This is visualization only and can showcase how things are playing out, but more than likely the only thing to fix the current situation will be to add capacity to the system and work through the backlog.
Can geospatial help fix these situations in the future?
I believe so. There are three key things that we can do with geospatial data and analysis to help prevent similar issues in the future:
- Identify gaps and risks earlier
- Improved modeling of consumer demand
- Create resilient solutions to see delays before they happen across the supply chain
Identify gaps and risks earlier
The first step in the process is identifying any potential risk, small or large, at macro and micro scales, that can disrupt a supply chain.
This includes data such as macro trends:
- Geopolitical threats
- Political instability
- Health or pandemic risk
- Labor shortages
Or more granular insights such as:
- Vehicle movement at facilities/borders (using earth observation data)
- Weather warnings and risk
- Potential for climate-related disasters
Practically, once facilities and other assets are intersected with the macro and microdata, a risk index can be created to analyze the relative risk across all locations. This post describes how to create an index in SQL in detail.
Many of these datasets will show risk at a national scale, but some will have more granular data down to the metro area or lower. This will help create a moving index of risk. There are data sources for these use cases as linked above.
It is here that earth observation and satellite imagery data can provide more granular insights such as ship/vehicle movement and weather/climate issues. Providers such as Planet and Climate Engine provide this data for raw analysis as well as derived insights from that data which is ready to use.

Improved modeling of consumer demand
Understanding consumer demand is the second critical component for analyzing supply chain shifts. While the changes experienced during COVID-19 were astronomical and mostly unpredictable, catching more modest fluctuations within changing consumer preference can be achieved with geospatial data at a lower level.
Different data providers have consumer segmentation data that allows you to see geographic areas, such as a Census Block Group in the US, and the consumer segments within them.
Many times these segments have creative names such as #TechTitans, but there is a lot of science that goes into creating them. Providers like Spatial.ai, Dstillery, Experian, and others all have great data focused on consumer segments
To use this data to pick up on consumer changes, companies can combine this with human mobility data, or data derived from mobile devices that are aggregated and anonymized. This allows you to see where customers live that come to your stores or points of sale.
Taken in aggregate, you can combine those areas with consumer profile data to see how your consumer base is changing as data is updated. Providers like Safegraph and Unacast provide this data in easy-to-use formats to join the mobility insights to customer profiles data.
How do you do this? First, create trade areas using the mobility data. Based on users that have visited a location, find the home geometries of those users. This gives you a granular view of who is coming to a specific location. Once you have this, you can tie the consumer segmentation data back to the locations using the newly created trade area. For online purchases, you can start to enrich your existing customer data with consumer profile data based on an order location.
As this data is regularly updated, you can start to see changes and shifts in consumer patterns, and specifically within which customer segments those are taking place, and finally, which areas or stores might also start to see those shifts.


Create resilient solutions to see delays before they happen across the supply chain
The final step is to use this data to create solutions to understand and see delays or issues before they happen, as well as creating tools to improve efficiency in delivery and monitoring:
- Analyzing risk and connectivity across the supply chain in solutions (Interos)
- Enabling long-range and short-range tracking and monitoring of deliveries using telematics like (Geotab)
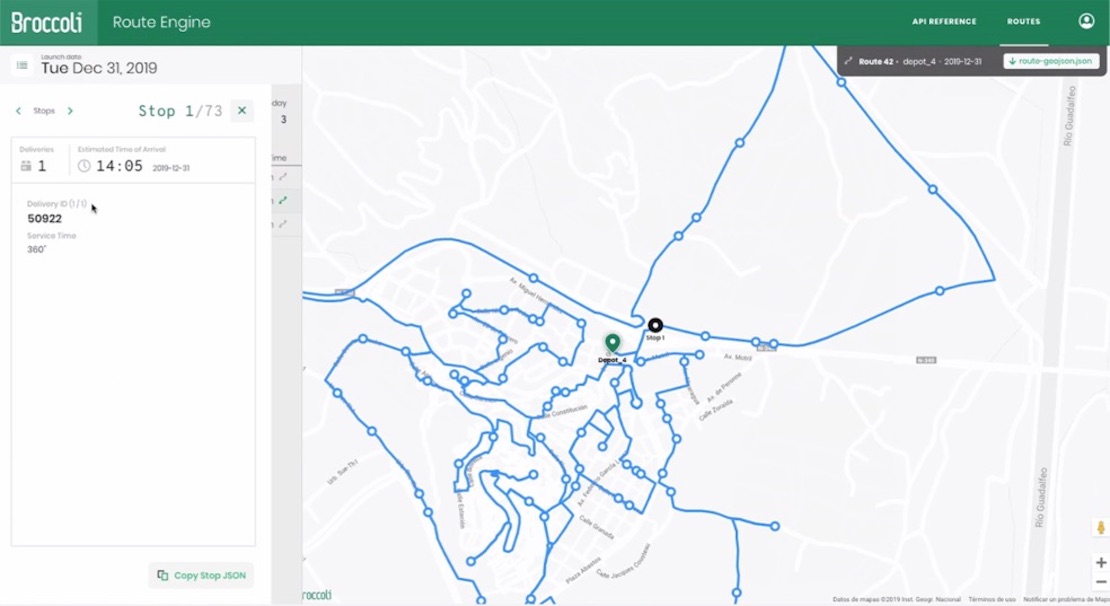
- Last-mile delivery and optimization solutions accounting for multiple constraints (CARTO)
- Model consumer demand and product stocking/restocking as it changes and shifts based on order and consumption patterns using “digital twin” supply chains (Google Cloud)
These solutions are critical for not only monitoring the current situation across any given supply chain but also modeling the supply chain and how potential risks or disruptions can affect how an organization sources and ships goods.
Geospatial is central to all these use cases, and geospatial technology and data will be key elements in powering these tools to help organizations small and large understand and respond to fluctuations both small and large in ways that previously were never available.