Top Modern GIS Skills for Spatial Data Science in 2022
Spatial data science has been one of the fastest-growing career paths in modern GIS in the past few years. The combination of the boom in the data science path, proliferation and popularity of Python, and demand for more flexible/technical roles in data science and analytics have spilled over into modern GIS.
Yet spatial data science has always been around in some form or another, sometimes known as spatial statistics or other names, and the recent growth in the field has also muddied the waters about what it means to practice spatial data science. I have seen positions for spatial data science that run from pure data science and modeling with a light background in geospatial, to a core focus on imagery analysis, to much more of a geospatial data engineer, to what could best be called a Python GIS analyst.
The Spatial SQL Book – Available now!
Check out my new book on Spatial SQL with 500+ pages to help you go from SQL novice to spatial SQL pro.
The lines defining spatial data science have become blurry, and more importantly what are the core modern GIS skills you need for spatial data science. This post will look at the core modern GIS skills needed by spatial data scientists to help focus the practice a bit more.
Data Processing/ETL
💾 💾 💾 💾 💾 💾 ⬜️ ⬜️ ⬜️ ⬜️ (6/10)
Spatial data scientists will certainly need some data processing and ETL skills but not to the level needed by other areas. Ideally, the team would also have a Geospatial Data Engineer, but this isn’t always the case, particularly with small teams or those working as individuals.
Many times spatial data scientists will be working with data stored in a central database or data warehouse while also blending it with other data from local or remote files. And those files may or may not need some basic data processing. Depending on those files which could range from anything like a simple CSV to more specific formats or large data formats like parquet, you may need some basic skills to translate and read that data or manipulate the geometry data in those files to be readable in Python.
The core geospatial data engineering toolkit is GDAL, which can be run locally, via Python, or through common libraries like fiona, Rasterio, or Geopandas.
shapefile, GeoJSON files and more using the command:
store gridded raster datasets such as satellite imagery and terrain models.
Rasterio reads and writes these formats and provides a Python API based on
Numpy N-dimensional arrays and GeoJSON.
Spatial SQL
⚙️ ⚙️ ⚙️ ⚙️ ⚙️ ⚙️ ⚙️ ⚙️ ⚙️ ⚪️ (9/10)
As SQL is critical to data science, so is spatial SQL to the spatial data scientist. The argument for SQL in data science communities is that large enterprise organizations, specifically the FAANG companies that so many data scientists aspire to join, store their data in databases and data warehouses that use SQL.
The more efficient you can be with your SQL, the faster you can prepare data for your analysis and ensure there are no errors in the data (such as duplicates, missing fields, data type issues, etc.)
For modern GIS, this looks a bit different. If you are going to an organization like those above then the same argument holds true. However, you may be working for a smaller organization where an enterprise database or data warehouse may be overkill, or you are one of (or the only) GIS user. That said a database or data warehouse can still provide organization and structure to your data, and while a bit more work is required upfront, down the line, and in small pieces (like data loading and transformations) that work can pay dividends and open up more possibilities in the future.
With that said there are four main use cases for spatial SQL for spatial data scientists:
- Connect and work with other enterprise data
- Store, manage, and prepare data prior to analysis
- Spatial feature engineering
- Working with larger or more complex data
You can read more about these and other use cases here but the spatial SQL layer in a spatial data science workflow can be highly beneficial and is, in my mind, an important part of the spatial data science toolkit.
Desktop Tools
🖥 🖥 ⬜️ ⬜️ ⬜️ ⬜️ ⬜️ ⬜️ ⬜️ ⬜️ (2/10)
Desktop tools are ranked the lowest for spatial data science skills for a few reasons. The first is that the majority of the workflows and tools are code-based, and the majority of those in Python and Jupyter notebooks. Many of the same tools and workflows that exist in desktop tools can be replicated, and most importantly scaled, in these environments.
That said desktop tools like QGIS can provide a visualization engine for static and dynamic maps of outputs of spatial data science workflows, and tools like GeoDa that embed analysis from libraries like PySAL in a desktop tool.
Geospatial Python
🐍 🐍 🐍 🐍 🐍 🐍 🐍 🐍 🐍 🐍 (10/10)
Apart from R, Python is fast becoming (if it has not already) the single most central language to many geospatial processes, and even more so to spatial data science. Most college and free courses on spatial data science are Python-focused, and many of the core spatial data science libraries like PySAL, and other core geospatial libraries are based in Python.
Doubling down on this is the fact that the generic data science ecosystem is focused on Python and many times spatial data scientists will need to make use of these libraries and integrate them with their geospatial workflows.
Since almost all spatial data science workflows will take place within Python or Jupyter notebooks, an understanding of core geospatial libraries like Geopandas and Rasterio will also be critical.

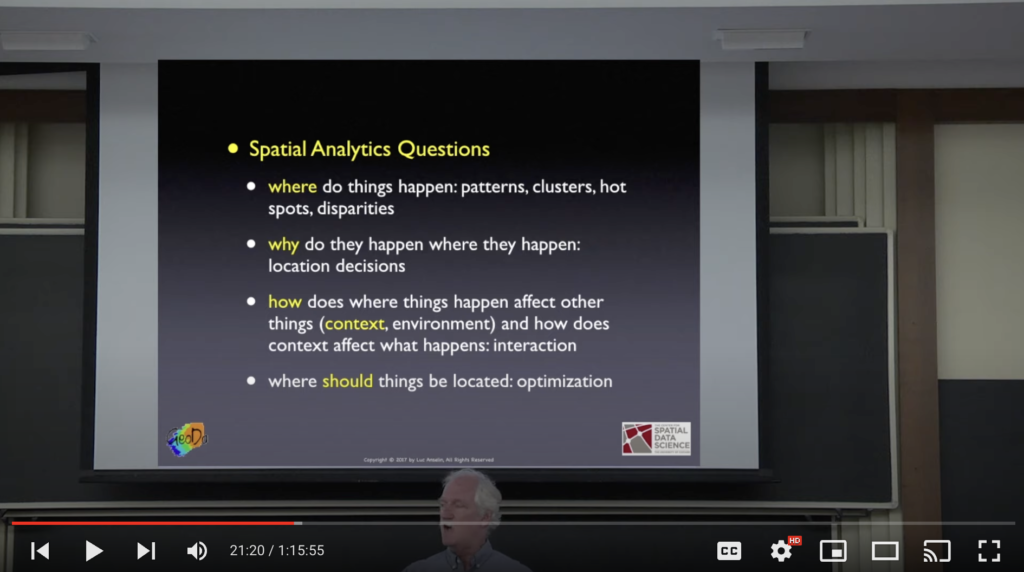
Spatial Data Science
🤖 🤖 🤖 🤖 🤖 🤖 🤖 🤖 🤖 🤖 (10/10)
Surprise, surprise. Spatial data science is of course a critical skill for spatial data scientists. With that said, there are a few different focus areas within spatial data science to focus on.
Pure Spatial Data Science
This is the core of spatial data science, using spatial relationships and arrangements to analyze spatial data using statistical methods. Many individuals study and research for years to create and improve models and methods to study spatial interactions.
There are many fantastic programs at universities around the world to study spatial data science, and more are being added and created every year.
Additionally, thanks to the amazing work of a large and growing community of spatial data scientists, they have made their work available to all with the development of the PySAL ecosystem. If you are doing any sort of spatial data science, then you absolutely need to familiarize yourself with PySAL.
It has amazing sample notebooks, guides, and tutorials along with other courses to get started as well.
Data Science with Spatial Data
Data science as a whole often comes across geospatial data in the form of lat/long values, city and location names, and even fields like Census Tract IDs. Using this data to enrich data with other location data is another way that modern GIS can help to enrich or augment existing data science workflows.
This requires an understanding of the core set of data science tools such as machine learning model and more. There are plenty of tutorials to help you get started, but here are some of my favorites.
Complete Machine Learning Walkthrough: Part 1, Part 2, Part 3
Geospatial Feature Engineering
This has to be my favorite way to bridge the worlds of modern GIS and the much larger data science, and even data engineering ecosystems. Geospatial feature engineering is the method of using geospatial data and relationships to create new features to use in machine learning models.
This could be something as simple as the population within a certain radius, the average income of surrounding neighboring areas, elevation profiles between areas, the number of points in a cluster, nearest neighbor analysis, and many more.
Below is a detailed guide on this process from the same authors of the PySAL guides listed above.
Visualization
🎨 🎨 🎨 🎨 ⚪️ ⚪️ ⚪️ ⚪️ ⚪️ ⚪️ (4/10)
Inevitably as a spatial data scientist, at some point, you are going to create a map. Now you do not need to be a full-blown cartographer or even a visualization expert. That said, a basic understanding of what visual methods to use to display data and the ability to create clear and compelling data visuals, all while ensuring that you don’t overpower or display too much information will be key.
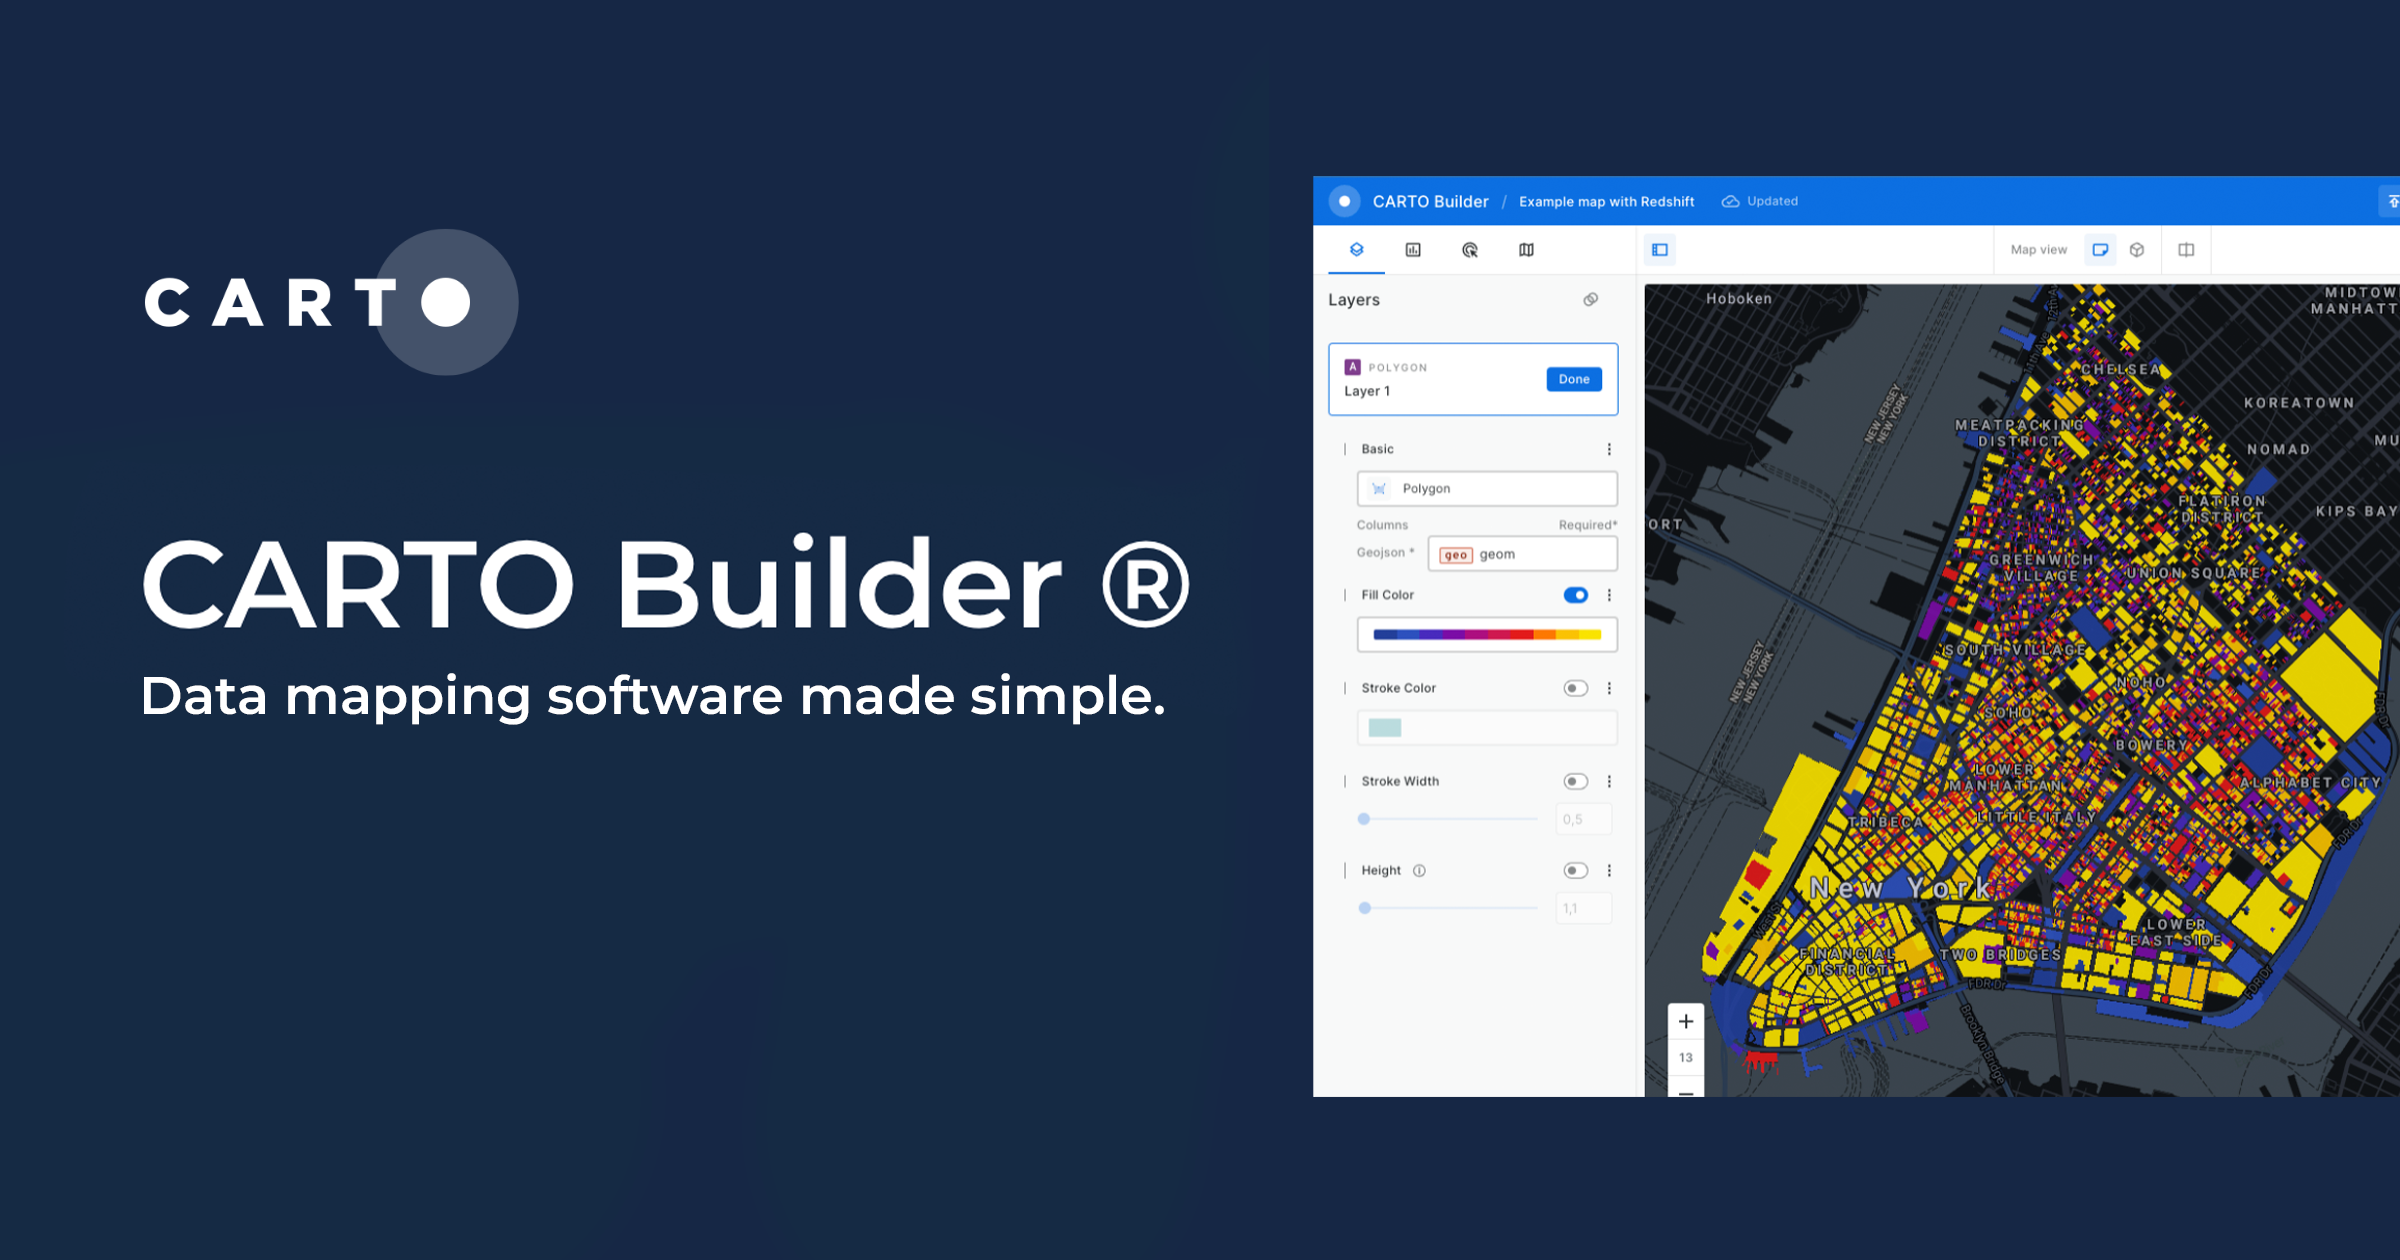
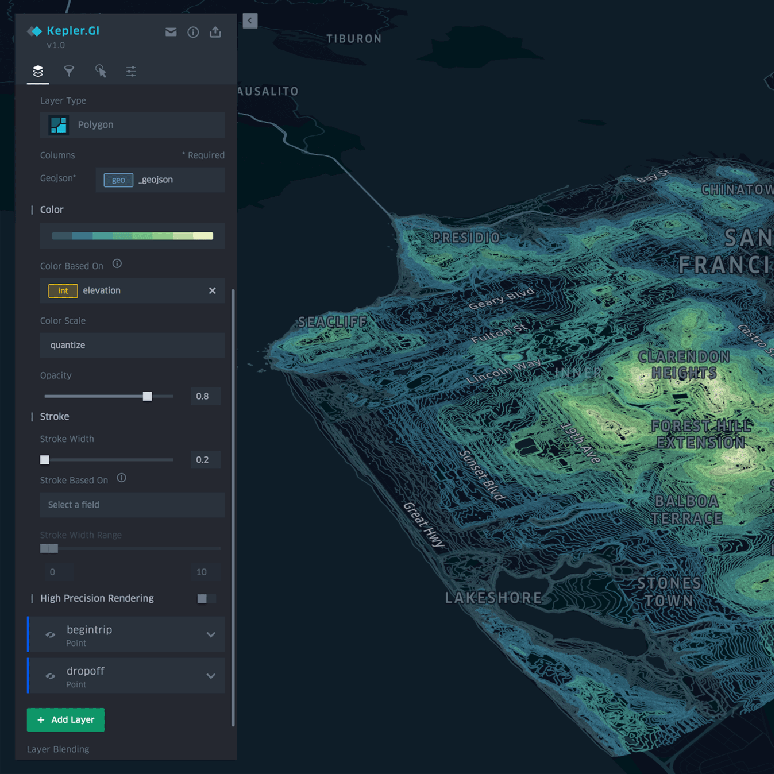
I recommend leveraging tools and libraries that provide basic components for you such as Kepler GL (used in the app or in their notebook extension) or CARTO Builder. This will elevate far beyond simple points on a map or notebook images.
Application Development
⚛️ ⚛️ ⬜️ ⬜️ ⬜️ ⬜️ ⬜️ ⬜️ ⬜️ ⬜️ (2/10)
Definitely lower on the list in terms of core skills. Many times if you need to build a full-scale, application you can lean on a geospatial developer or other teams to integrate the data outputs you have created into complex apps.
That said, having some basic Javascript to build a simple map or single page app can’t hurt, although many of the dashboarding tools that exist today can take you really far.
Dashboards
📋 📋 📋 📋 ⬜️ ⬜️ ⬜️ ⬜️ ⬜️ ⬜️ (4/10)
In line with the past two skills, providing the data and insights you have created in compelling and interactive formats is key to engaging key stakeholders. You do not need to be a dashboard wizard but ensuring that you have the right mix of visual layers, filters/widgets, and other components can help you communicate your message well.
Similar tools to the above like Kepler GL and CARTO can help you achieve this with minimal effort, but always look for inspiration in other maps and dashboards to bring fresh ideas to your data.
Communication Skills
🙋♀️ 🙋♀️ 🙋♀️ 🙋♀️ 🙋♀️ 🙋♀️ 🙋♀️ ⚪️ ⚪️ ⚪️ (7/10)
Communication is critical for spatial data scientists, and not just the skills to communicate about the methods, data, and approaches for your work, but even more so being able to communicate to different stakeholder groups that may or may not have an understanding of geospatial.
First, make sure you know your audience. Business users generally may not need to know the details on the models you used, but are rather focused on the insights and recommendations you would make. Find a balance of theory and insights that are right for your group.
Second, make sure they understand the process you used and the data used in your analysis, most importantly what are the important factors driving your analysis. This will help them understand the layers of information you used to drive your insights.
But most important of all, do your research prior to building your analysis. You simply must understand the business processes, workflows, and that are driving current outcomes. Once you understand the current state of operations, you can see where there are things that can be changed, and where to focus your efforts. This also helps to build rapport with your stakeholder groups, and to help them see that you relate to their challenges and current processes.